report · The Bigger We
The Bigger We
Map Shows Which Neighborhoods Help Each Other Most
The Social Trust Map is a special online tool that shows how well neighbors help and connect with each other across the United States. Created by Weave at the Aspen Institute, this interactive map looks at three key areas: how people act to help others, how they show they care, and what places exist for people to meet and connect. The map gives every neighborhood a trust score to show where communities are strong and where they need more support. Community organizers can use this tool to find neighborhoods that work well together and areas that need help building connections. Local governments can make better decisions about where to spend money on community programs. Nonprofit leaders can figure out where to focus their work. Regular people can explore their own neighborhoods to find ways to get involved and help build stronger communities. The map updates regularly with new information and shows trends over time. Users can spend 15-30 minutes exploring the map to understand their area better and compare it to nearby neighborhoods. This tool helps communities build trust, belonging, and support at the local level by showing where connection is already happening and where more work is needed.
March 5, 2026·Weave: The Social Fabric Project at the Aspen Institute·The Change Lab

Article
The Social Trust Map is a special online tool that shows how well neighbors help and connect with each other across the United States. Created by Weave at the Aspen Institute, this interactive map looks at three key areas: how people act to help others, how they show they care, and what places exist for people to meet and connect. The map gives every neighborhood a trust score to show where communities are strong and where they need more support. Community organizers can use this tool to find neighborhoods that work well together and areas that need help building connections. Local governments can make better decisions about where to spend money on community programs. Nonprofit leaders can figure out where to focus their work. Regular people can explore their own neighborhoods to find ways to get involved and help build stronger communities. The map updates regularly with new information and shows trends over time. Users can spend 15-30 minutes exploring the map to understand their area better and compare it to nearby neighborhoods. This tool helps communities build trust, belonging, and support at the local level by showing where connection is already happening and where more work is needed.
Read the full guide
We found this for you at Weave: The Social Fabric Project at the Aspen Institute
AI Summary
Let us break this down in plain language.
Related
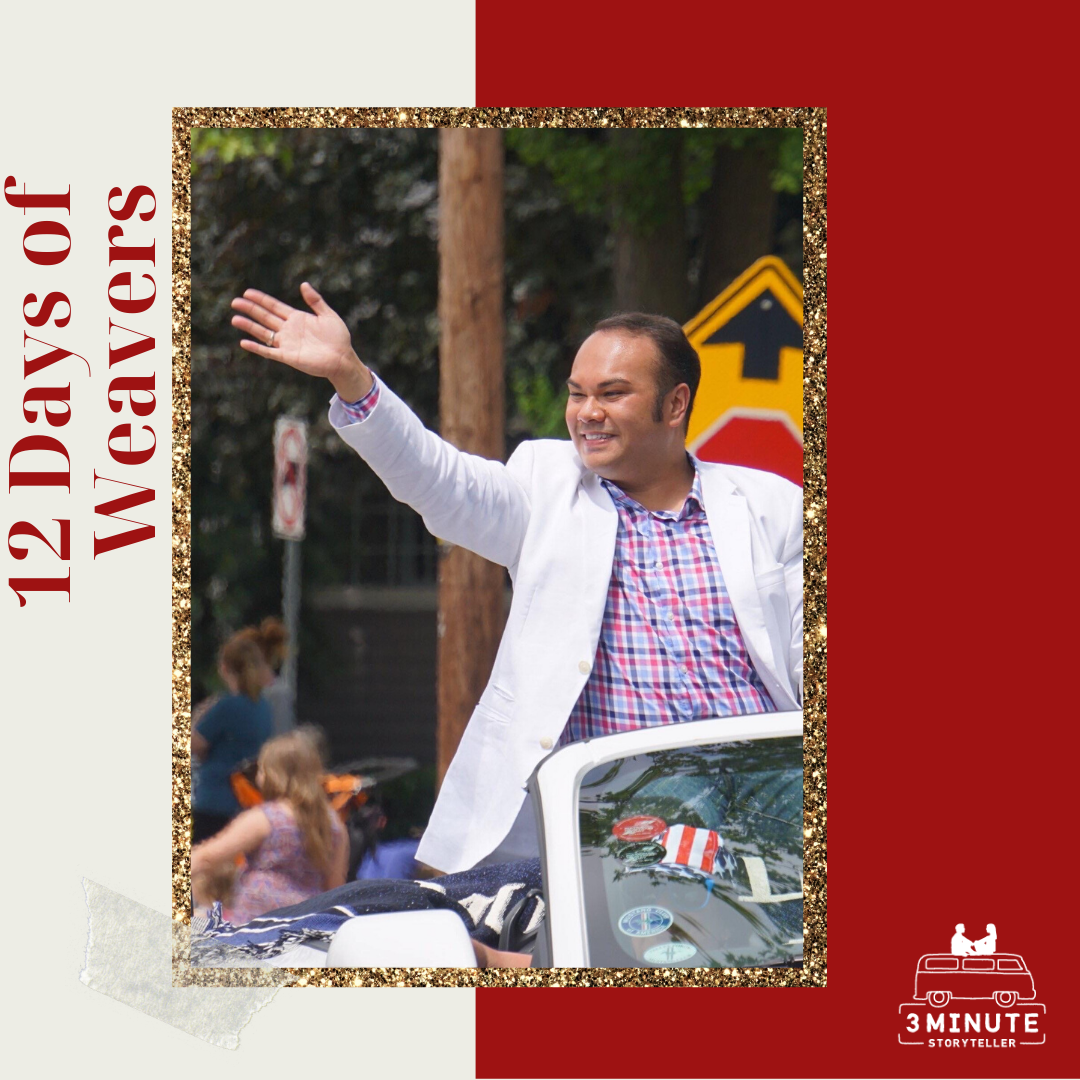
The Bigger WeStories of Community Builders Who Weave Neighbors TogetherThis article shares inspiring stories of three community builders from Phoenixville, PA who found ways to connect neighbors and strengthen their town. Maddie Goodwin started PXV Gives after the Women's March to help people find volunteer opportunities with local nonprofits. Julie Miller, an English teacher for immigrants, created a Spanish library and builds bridges between immigrant families and the community. Teresa Haag paints murals that bring beauty to the town and create spaces for neighbors to share stories. These 'weavers' show how regular people can make their communities stronger by building relationships and helping others get involved. Their work demonstrates that lasting change happens when neighbors know and care for each other. The stories are part of a series celebrating everyday people who create positive change in their communities through small but meaningful actions.
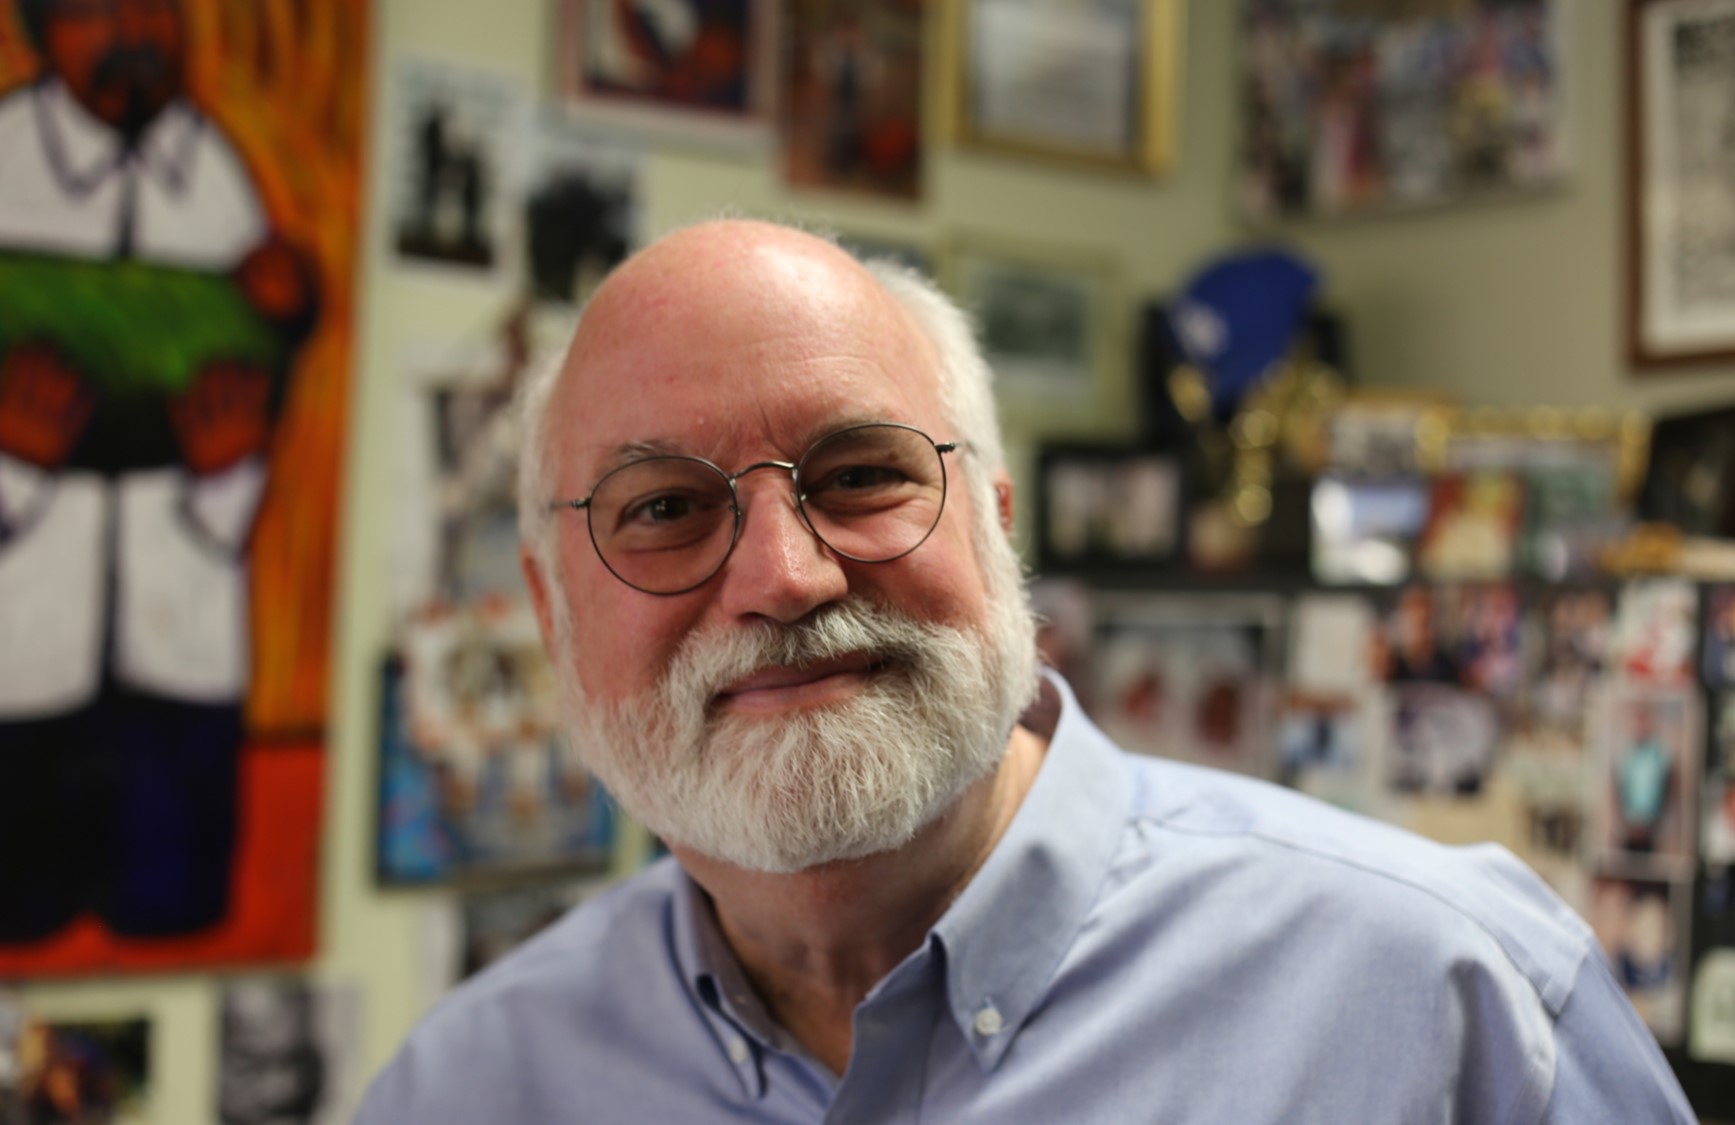
The Bigger WeFather Greg Shows How Community Heals Gang ViolenceFather Gregory Boyle runs Homeboy Industries, the world's largest program helping former gang members. He says gang violence comes from having no hope, and nobody who feels hopeful joins a gang. At Homeboy, people get job training, mental health help, and most importantly - hope and belonging. Father Greg believes you don't go to help people in tough situations to save them, but to be saved yourself. Every day starts with a family meeting where everyone feels welcomed. Former gang members learn skills and then help others, breaking the cycle of violence. The program creates a safe space where people feel loved and accepted just for showing up. Father Greg's approach shows that when we treat people with dignity and give them community, they can transform their lives and help others do the same. The story explains how radical love and acceptance can heal deep wounds and create lasting change in communities affected by violence.
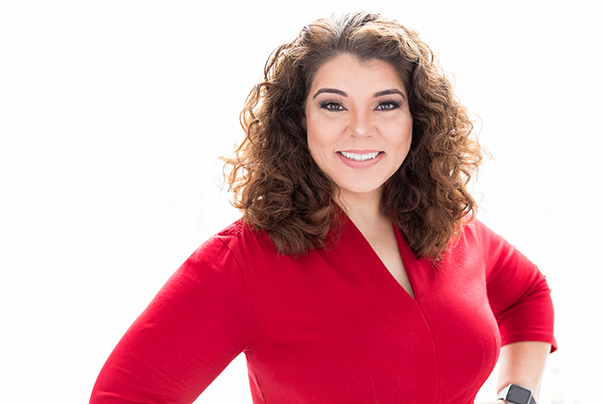
The Bigger WeHow True Listening Creates Stronger Connections Between PeopleNPR journalist and author Celeste Headlee explains how good listening can help people connect better with each other. In her book 'Do Nothing,' she talks about how modern life moves too fast and makes it hard to build real relationships. Headlee says humans became successful not because we're the strongest or smartest, but because we're good at talking and working together. She explains that we even evolved in ways that let us speak better, even though it made us more likely to choke on food. During COVID-19, when people couldn't be close to each other, this became even more important. Headlee teaches that the best way to change someone's mind isn't to argue with them, but to really listen and understand their feelings. She says every person deserves respect, even if we don't agree with their opinions. Good listening doesn't mean you agree with everything someone says. When we truly listen to others, we can build empathy and understanding. This can help heal our divided communities and bring people together, especially during hard times like the pandemic.
The Bigger WeStories That Inspire and Connect People3 Minute Storyteller is a platform that shares short, inspiring stories designed to spark meaningful conversations. The website features stories across different categories including spirituality and mindfulness, self-discovery, social good, sciences, leadership, and creativity and the arts. The platform encourages people to connect through storytelling and offers a newsletter 'For the Love of Conversation' to help build community through shared narratives. While the specific content of individual stories isn't detailed in this overview, the platform appears focused on using brief storytelling formats to inspire personal growth, social connection, and meaningful dialogue between people from different backgrounds and experiences.
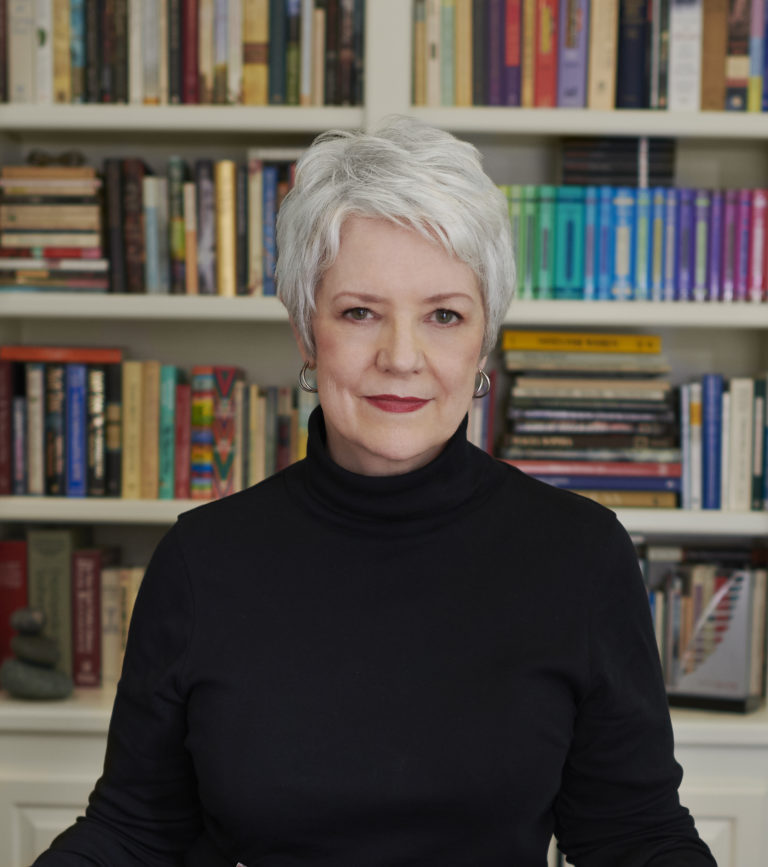
The Bigger WeAuthor Sue Monk Kidd on Finding Support to Live Your True SelfFamous author Sue Monk Kidd talks about how we need both personal strength and support from others to live our fullest lives. She wrote bestselling books like 'The Secret Life of Bees' and shares how her own journey from traditional Southern Baptist wife to successful author required both inner work and help from friends. In her latest book 'The Book of Longings,' she tells the story of Ana, who she imagines as Jesus's wife, and how Ana needs her Aunt Yaltha's support to find courage. Kidd believes we can't transform ourselves alone - we need what she calls 'Aunt Yalthas' in our lives, people who believe in us and bless our potential. She says American culture teaches us to be independent, but real growth happens in relationships. During tough times like COVID-19 and racism, we need each other even more. The key is finding people who support your dreams while also being willing to support others. This balance of personal growth and community support helps us become who we're meant to be.
The Bigger WeStudent Reporters Bridge Divides Through Collaborative News StoriesNews Ambassadors connects student journalists from different political and geographic areas to work together on news stories. Students from places like rural Missouri and New York City partner up to report on community problems and solutions. The program teaches special reporting methods that focus on finding common ground instead of creating more division. Student reporters learn 'Solutions Journalism' - covering how communities solve problems rather than just reporting on what's wrong. They also learn 'Complicating the Narratives' - a way to report on controversial topics that helps people understand different viewpoints. The program pairs journalism schools with public radio stations across the country. Students get training, mentorship, and editing help from their professors. The best stories are broadcast in both partner locations, so communities with different political views can hear each other's perspectives. The program also trains radio stations to do 'Community-Responsive Reporting' - getting story ideas directly from community members, especially in rural and urban areas that don't get enough news coverage. This helps fill gaps in local news while giving student reporters real-world experience. The goal is to help Americans better understand each other across political divides and strengthen democracy through better journalism.
Go deeper
The Change Lab 2025 Annual Report: Building Civic Infrastructure Through Community Connection
“ THE CHANGE LAB A community of practice 2025 ANNUAL REPORT THE CHANGE LABthechangelab.net · A fiscally sponsored project of Impact Hub Houston · Page 1 of 2 We connect by serving and learning toget...”
p. 1Read more →
Social Connection in America: 2025 Survey Report on Community Bonds and Well-Being
“ 2025 Survey Report About This Project This survey will catalyze a broad and lasting impact—transforming how we define, prioritize, and support social connection in America. This survey is led by D...”
p. 1Read more →
The Connection Opportunity: Building Bridges Across Difference in America
“ March 2025 Insights for Bringing Americans Together Across Difference The Connection Opportunity 2More in CommonThe Connection Opportunity ABOUT MORE IN COMMON The report was conducted by More in ...”
p. 1Read more →